Authored by Jeremy Goh
While 2020 oil and gas production volumes have fallen from
2019 levels, gas production has been much less affected. Muse has examined the
recent issues and can provide some guidance for 2021, based on our analysis.
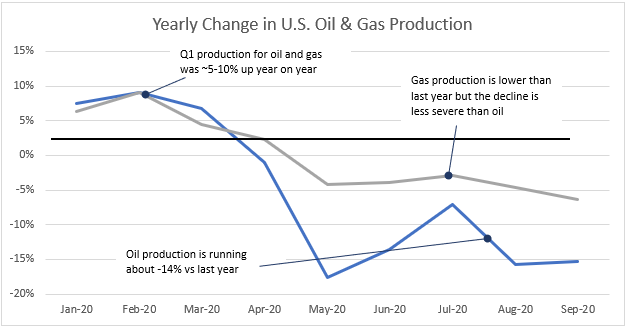
2020 was shaping up to be a banner year for oil and gas
production in the United States. In the first quarter of the year, oil and gas
production was up 5-10% year on year compared to 2019.
New pipelines were delivering more oil to market, and the
additional production had contributed to the U.S. becoming a net oil exporter
in December 2019.
A number of new gas pipelines also came on-line, providing
access to markets for additional gas from the Permian Basin, and also
delivering higher gas exports to Mexico.
Then, the COVID 19 shutdown hit the economy in March,
causing pain in the United States and globally. This caused a massive decline
in demand for energy, and the transportation fuels were especially hard hit.
As a result, May-Sep oil production is down 14% compared to 2019, and gas is down less, at 4.4%[1].
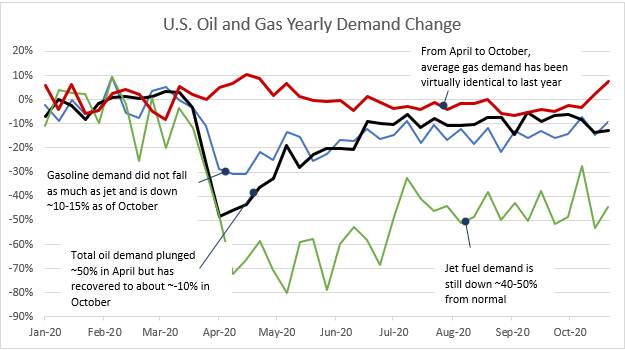
Oil demand has declined dramatically, but gas demand is generally steady
Crude oil demand plunged by nearly 50% year on year in April, but has since recovered to a decline of about 10-15% in October. Gasoline demand fell steeply in April but recovered to show a yearly 10-15% decline by October. Not surprisingly, jet fuel has been the largest loser of the transportation fuels, and is still running 40-50% below last year’s demand numbers in October. Demand for jet fuel is expected to remain stagnant until air travel resumes, and may demonstrate one of the slowest recoveries of all the fuel segments.
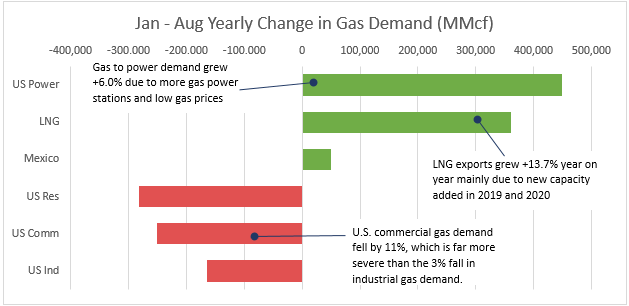
On the other hand, natural gas demand has demonstrated more resilience, and between April and October has averaged just 0.2% lower than 2019. Some months have actually shown greater demand than 2019.
Over the course of 2020, gas demand growth into power, LNG exports and exports to Mexico have roughly offset weak residential, commercial and industrial demand. The data does hide large month to month swings in LNG demand due to weak price differentials and hurricane impacts, and in power demand due to temperature and a growing proportion of gas in power generation. Natural gas exports to Mexico have also notably increased by almost 3% despite the severe impact of COVID-19 on the industrial sector there.
Why gas production fell when the demand was steady
Many might question why year-on-year gas production has fallen when the demand has stayed relatively constant. The underlying data point to the fact that a significant proportion of natural gas production in the U.S. is associated gas – that is, it is a by-product of crude oil production.
As is the case, when crude oil prices fall, declines in drilling and production rates lag the price declines. There were related declines in the production of associated gas, especially in the regions (Permian, Bakken, and Eagle Ford) that are large producers of crude oil.
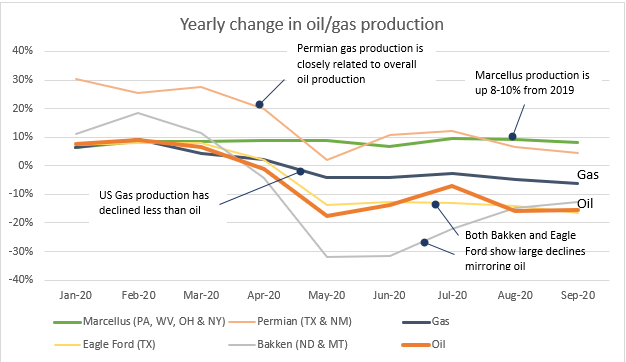
In the chart above, the liquid rich shales , including the Bakken and Eagle Ford, have the largest declines as their production is associated gas. The Permian also shows a large decline, mirroring oil volume declines, but this is masked somewhat by the large annual growth it had displayed in the first quarter of 2020.
For gas production, however, it is very noticeable that the Marcellus has shown an increase in production over 2019.
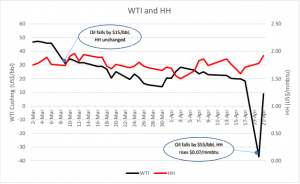
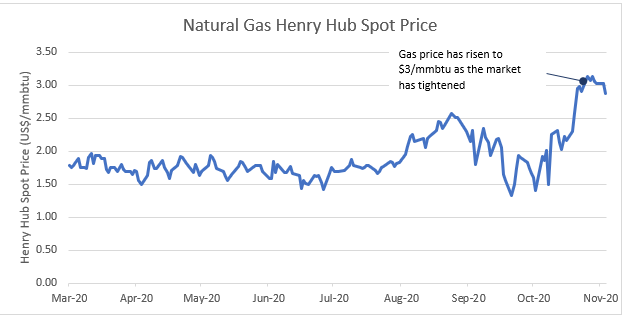
A tightening gas market has seen a rebound in gas prices
Oil and gas supply and demand have responded differently to the COVID-19 crisis. From April to October, oil demand fell by 17% while gas demand was virtually unchanged. In the same period, oil production fell about 12% while gas production fell around 3%. The impact of the tightening gas market can be seen in the rise in gas prices recently to around $3/mmbtu, nearly doubling in August from the March values.
Looking Forward
Going into late 2020 and 2021, the trajectory of economic
recovery from COVID-19 is still very uncertain. Muse projects that the WTI
price for 2021 and 2022 will remain in the $40-$50/bbl range, and will start rising
when demand eventually recovers.
We anticipate that the Henry Hub natural gas price will
remain around the $3/mmbtu level, as we do not foresee large increases in
natural gas supply until crude oil process start to increase, and the increased
crude oil demand positively impacts natural gas production.
If the economic recovery occurs more quickly than we expect,
oil demand should rise faster than gas demand. Associated gas production will
also rise quickly with increased oil production, thus leading to a looser
supply/demand balance for natural gas.
[1] Source – EIA